繁 EN
menu
Sustainable Environment

Sustainable Environment

Energy and Greenhouse Gas Management

UN Sustainable Development Goal 7UN Sustainable Development Goal 11UN Sustainable Development Goal 13

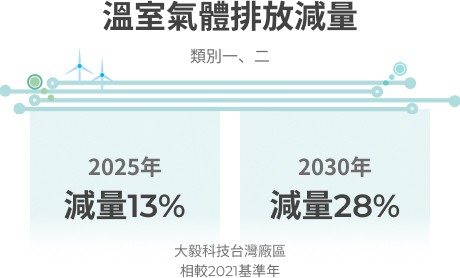
GHG Emissions Reduction Scope 1 & Scope 2 (Taiwan Sites)

2025

8.06%

(Compared to 2021 Base Year)

2030

28%

Reduction Target

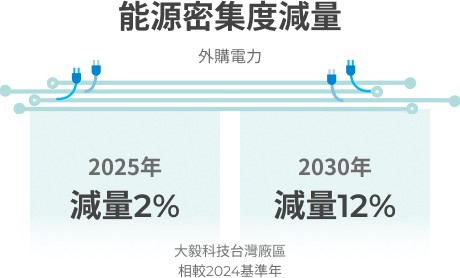
Energy Intensity Reduction

2025

16.1%

2025 reduction: 16.1%. Annual target: 1% reduction vs. the previous year.

2030

12%

Reduction Target

Governance Structure and Policy Commitments

Responsible Units (Governance)

The responsible unit coordinates energy and greenhouse gas (GHG) management, collaborating with facility management, production, quality assurance, procurement, and finance departments to ensure data integrity and traceability.

The key management mechanisms are as follows:

  1. Energy Monitoring Mechanism: Guided by ISO 50001 principles, daily monitoring is applied to production processes, utility systems, and facility power consumption to regularly evaluate energy usage and savings performance.
  2. GHG Inventory Mechanism: Standardized Scope 1 and Scope 2 accounting protocols are established to comprehensively measure fuel combustion, fugitive emissions, and purchased electricity.
  3. Data Verification & Audit: Rigorous data collection, internal control reviews, and third-party verification are conducted to uphold data credibility, ensuring an accurate baseline for decarbonization tracking and ongoing optimization.

Policy Commitments (Strategy)

  1. Energy Efficiency & Process Optimization: Upgrades and replaces HVAC, air compressor, and key production equipment to continuously reduce unit energy consumption.
  2. Process Improvements: Introduces low-energy technologies and thick-film printing processes to simplify manufacturing, reducing energy, chemical, and liquid waste treatment needs.
  3. Renewable Energy Promotion: Optimizes the energy structure by driving solar self-generation/self-use and renewable energy certificate (REC) applications.

Impact Assessment (Risk Management)

Negative Impact (Risk)

Operations continue to consume energy and generate emissions, facing cost pressures from energy prices, carbon fees, and regulations. Failure to respond effectively could impact product competitiveness, disclosure quality, and customer partnerships.

Positive Impacts (Opportunities)

Establishing energy management and verification mechanisms improves data quality and management foundation. Driving energy efficiency and renewable energy measures steadily reduces energy intensity and emissions, boosting supply chain competitiveness and client collaboration.

Metrics and Targets

Metrics and Targets
Metrics 2025 Actual (Taiwan) 2025 Target Target met 2026 Target (Group) 2030 Target (Group) 2040 Target (Group)
Scope 1 and Scope 2 GHG Emissions Reduction – Taiwan Sites (2021 Baseline) 8.06% 13% ✕ 15% 28% 40%
GHG Emissions Intensity Reduction (vs. Previous Year) 15.9% 2% ✓ 2% 2% 2%
Purchased Electricity Intensity Reduction (vs. Previous Year) 16.1% 1% ✓ 1% 1% 1%

2025 GHG Emissions (Scope 1 and Scope 2)

Plant SiteCategoryEmissions (tCO₂e)YoY Change and Share
Taiwan Sites (Changxing / Nanshan) Scope 1 579.050 Increased by 15.13% YoY due to higher diesel consumption
Scope 2 25,426.308 Increased by 3.85% YoY due to higher electricity consumption
Total 26,005.358 82.3% of the Group’s total GHG emissions
China Sites (Suzhou / Dongguan) Scope 1 112.540 Decreased by 14.73% YoY due to lower fuel consumption
Scope 2 5,465.040 Electricity consumption increased slightly by 1.69% YoY
Total 5,578.000 17.7% of the Group’s total GHG emissions

Taiwan Sites (Changxing / Nanshan)

Scope 1
Emissions (tCO₂e)
579.050
YoY Change and Share
Increased by 15.13% YoY due to higher diesel consumption
Scope 2
Emissions (tCO₂e)
25,426.308
YoY Change and Share
Increased by 3.85% YoY due to higher electricity consumption
Total
Emissions (tCO₂e)
26,005.358
YoY Change and Share
82.3% of the Group’s total GHG emissions

China Sites (Suzhou / Dongguan)

Scope 1
Emissions (tCO₂e)
112.540
YoY Change and Share
Decreased by 14.73% YoY due to lower fuel consumption
Scope 2
Emissions (tCO₂e)
5,465.040
YoY Change and Share
Electricity consumption increased slightly by 1.69% YoY
Total
Emissions (tCO₂e)
5,578.000
YoY Change and Share
17.7% of the Group’s total GHG emissions

Ensuring Action Effectiveness

  • In 2025, self-generated solar power reached 396,800 kWh, and waste heat recovery reached 30,000 kWh, effectively lowering Scope 2 emissions.
  • Carbon reduction results are regularly reported to the Board of Directors.

Stakeholder Engagement

  • Obtained ISO 14064-1 verification.
  • Emissions performance data is regularly reported to the Board of Directors.

Historical Energy Consumption Statistics

Total group energy consumption reached 232,726.28 GJ, with Taiwan sites accounting for 83.47%, Dongguan plant for 8.75%, and Suzhou plant for 7.79%.

Plant SiteEnergy Type (GJ)Y2024Y2025
Changxing Site Electricity 96,212.16 98,460.80
Renewable Energy 252.00 107.95
Non-Renewable Energy 95,960.16 98,352.85
Diesel 35.15 336.89
Gasoline – –
Total 96,247.31 98,797.69
Nanshan Site Electricity 89,736.48 94,555.99
Diesel 254.85 520.09
Gasoline 396.52 376.46
Total 90,387.85 95,452.54
Suzhou Site Electricity 17,168.85 18,010.03
Renewable Energy – 1,151.44
Non-Renewable Energy 17,168.85 16,858.59
Diesel 175.73 57.41
Gasoline – 55.33
Total 17,344.58 18,122.77
Dongguan Site Electricity 19,053.27 20,202.64
Diesel 226.13 129.06
Gasoline 20.64 21.58
Total 19,300.04 20,353.28
Group Total Output (Million Units) 194,987 233,500
Group Total Energy Consumption (GJ) 223,279.78 232,726.28
Group Energy Intensity (GJ / million units) 1.15 1.00

Changxing Site

Electricity
Y2024
96,212.16
Y2025
98,460.80
Renewable Energy
Y2024
252.00
Y2025
107.95
Non-Renewable Energy
Y2024
95,960.16
Y2025
98,352.85
Diesel
Y2024
35.15
Y2025
336.89
Gasoline
Y2024
–
Y2025
–
Total
Y2024
96,247.31
Y2025
98,797.69

Nanshan Site

Electricity
Y2024
89,736.48
Y2025
94,555.99
Diesel
Y2024
254.85
Y2025
520.09
Gasoline
Y2024
396.52
Y2025
376.46
Total
Y2024
90,387.85
Y2025
95,452.54

Suzhou Site

Electricity
Y2024
17,168.85
Y2025
18,010.03
Renewable Energy
Y2024
–
Y2025
1,151.44
Non-Renewable Energy
Y2024
17,168.85
Y2025
16,858.59
Diesel
Y2024
175.73
Y2025
57.41
Gasoline
Y2024
–
Y2025
55.33
Total
Y2024
17,344.58
Y2025
18,122.77

Dongguan Site

Electricity
Y2024
19,053.27
Y2025
20,202.64
Diesel
Y2024
226.13
Y2025
129.06
Gasoline
Y2024
20.64
Y2025
21.58
Total
Y2024
19,300.04
Y2025
20,353.28

Group Total Output (Million Units)

Y2024
194,987
Y2025
233,500

Group Total Energy Consumption (GJ)

Y2024
223,279.78
Y2025
232,726.28

Group Energy Intensity (GJ / million units)

Y2024
1.15
Y2025
1.00

Energy Efficiency, Carbon Reduction and Renewable Energy Initiatives

Plant SiteProject / InitiativeRenewable Energy Use /
Energy Savings
Estimated GHG Emissions Reduction
Changxing Procured small amounts of green power monthly starting July 2025 to meet customer demand. 30,000 kWh Approx. 14.22 tCO₂e
Chiller Replacement — Replaced two 101 kW chillers with one 104 kW unit. Energy savings: 629,270.4 kWh Approx. 298.27 tCO₂e
Nanshan Built rooftop PV generation facilities within the plant; increased PV power use starting June 2025, 100% self-generated and self-used. 396,800 kWh Approx. 188.08 tCO₂e
High-Temperature Sintering Furnace Retrofit: Replaced heating plates, insulation boards, insulation cotton, exhaust hoods, and blowers across 3 furnaces. Energy savings: 162,301 kWh Approx. 76.93 tCO₂e
Dongguan Built rooftop PV generation facilities within the plant; increased PV power use starting September 2025, prioritized for self-use with surplus sold back to the power grid by the vendor. 351,793 kWh Approx. 183.10 tCO₂e
Replaced 1 gasoline company vehicle with a new energy EV on June 25, 2025. Gasoline savings: 419.24 L Approx. 0.95 tCO₂e
Suzhou Procured wind green power in March 2025; procured solar green power from April to December 2025. 320,000 kWh Approx. 169.79 tCO₂e
Replaced 1 gasoline company vehicle with a new energy EV. Gasoline savings: 2,626 L Approx. 6.40 tCO₂e

Changxing

Procured small amounts of green power monthly starting July 2025 to meet customer demand.
Renewable Energy Use / Energy Savings
30,000 kWh
Estimated GHG Emissions Reduction
Approx. 14.22 tCO₂e
Chiller Replacement — Replaced two 101 kW chillers with one 104 kW unit.
Renewable Energy Use / Energy Savings
Energy savings: 629,270.4 kWh
Estimated GHG Emissions Reduction
Approx. 298.27 tCO₂e

Nanshan

Built rooftop PV generation facilities within the plant; increased PV power use starting June 2025, 100% self-generated and self-used.
Renewable Energy Use / Energy Savings
396,800 kWh
Estimated GHG Emissions Reduction
Approx. 188.08 tCO₂e
High-Temperature Sintering Furnace Retrofit: Replaced heating plates, insulation boards, insulation cotton, exhaust hoods, and blowers across 3 furnaces.
Renewable Energy Use / Energy Savings
Energy savings: 162,301 kWh
Estimated GHG Emissions Reduction
Approx. 76.93 tCO₂e

Dongguan

Built rooftop PV generation facilities within the plant; increased PV power use starting September 2025, prioritized for self-use with surplus sold back to the power grid by the vendor.
Renewable Energy Use / Energy Savings
351,793 kWh
Estimated GHG Emissions Reduction
Approx. 183.10 tCO₂e
Replaced 1 gasoline company vehicle with a new energy EV on June 25, 2025.
Renewable Energy Use / Energy Savings
Gasoline savings: 419.24 L
Estimated GHG Emissions Reduction
Approx. 0.95 tCO₂e

Suzhou

Procured wind green power in March 2025; procured solar green power from April to December 2025.
Renewable Energy Use / Energy Savings
320,000 kWh
Estimated GHG Emissions Reduction
Approx. 169.79 tCO₂e
Replaced 1 gasoline company vehicle with a new energy EV.
Renewable Energy Use / Energy Savings
Gasoline savings: 2,626 L
Estimated GHG Emissions Reduction
Approx. 6.40 tCO₂e