
2025
Reduction10.5%


Reduction10.5%
Reduction20%
(Compared to 2024 Base Year)
TA-I Technology adopted the World Resources Institute (WRI) Aqueduct water risk assessment tool to conduct simulations on "water resource stress and depletion" and "river/coastal flooding" for its four major plant areas in Changxing and Nanshan, Taiwan, and Suzhou and Dongguan, China. The results are shown in the table below:
| Assessment Item | Changxing | Nanshan | Suzhou | Dongguan |
|---|---|---|---|---|
| Water Stress | Low | Low | Extremely High (>80%) | Low |
| Water Depletion | Low | Low | Low | Low |
| Riverine Flood | Low | Low | High | Medium-High |
| Coastal Flood | Low | Medium-High | Low | Medium-High |
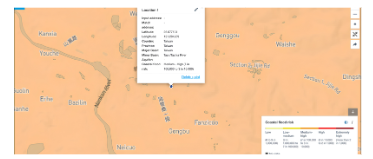
Hazard Indicator: 7 in 100,000 to 3 in 10,000. Coastal flood risks increase with climate change, sea level rise and extreme typhoon storm surges.
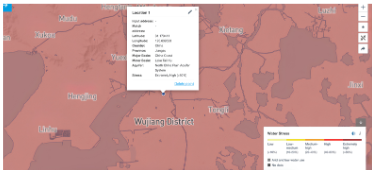
Hazard Indicator: Above 80% (Taihu Basin). Suzhou's water use is very low (24.69 million liters in 2025), so restrictions have limited production and financial impacts.
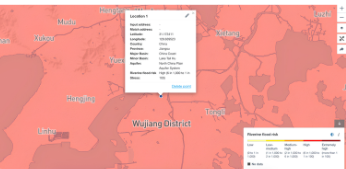
Hazard Indicator: 6 in 1,000 to 1 in 100. Extreme rainfall and seasonal storms raise the probability of river and Taihu water system overflow and damaging floods.
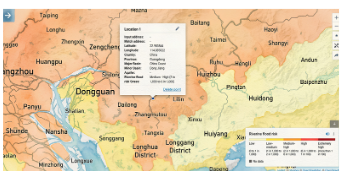
Hazard Indicator: 2 in 1,000 to 6 in 1,000. Extreme rainfall raises the probability of nearby river overflow and damaging floods.
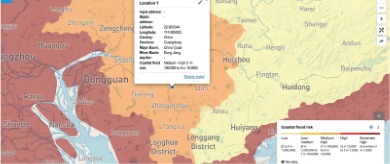
Hazard Indicator: 7 in 100,000 to 3 in 10,000. Geographic exposure to climate change, sea level rise and extreme typhoon surges creates coastal flood threats.
In 2025, total water withdrawal reached 386.886 million liters. Benefiting from process water conservation and recycling initiatives, water withdrawal intensity significantly decreased to 0.0017 million liters/million units (a cumulative 3-year improvement of 10.53%).
| Plant Site | Y2023 | Y2024 | Y2025 |
|---|---|---|---|
| Nanshan | 181.662 | 188.628 | 207.291 |
| Changxing | 116.771 | 117.280 | 120.285 |
| Suzhou | 40.799 | 24.675 | 24.692 |
| Dongguan | 30.725 | 32.788 | 34.618 |
| Total Water Withdrawal | 369.957 | 363.371 | 386.886 |
| Water Withdrawal Intensity | 0.0020 | 0.0019 | 0.0017 |
| Item (Megaliters) | Y2023 | Y2024 | Y2025 |
|---|---|---|---|
| Total Water Withdrawal (A) | 369.957 | 363.371 | 386.886 |
| Total Water Discharge (B) | 208.870 | 227.370 | 262.352 |
| Total Water Consumption (C = A − B) |
161.087 | 136.001 | 124.534 |
| Water Consumption Rate (C / A) | 43.54% | 37.43% | 32.19% |
Overseas Plant Achievements: By the end of 2025, the Dongguan and Suzhou plants completely phase out R-22 refrigerant, successfully replacing it with eco-friendly alternatives.
Taiwan Plant Planning: Existing refrigerant equipment currently totals 5 units with a combined refrigerant inventory of 21.5 kg. A full phase-out is planned before 2028 to advance toward the goal of zero ODS emissions.
| Plant Site | Pollutant Category (Unit: kg) | Y2024 | Y2025 |
|---|---|---|---|
| Nanshan | Volatile Organic Compounds (VOC) | 15,802.77 | 32,847.41 |
| Particulate Matter | 54.20 | 62.24 | |
| Changxing | Volatile Organic Compounds (VOC) | 44,616.89 | 42,525.26 |
| Particulate Matter | 50.95 | 59.53 |