Social Inclusion
Talent Cultivation and Diversity & Inclusion
STEM Talent
Industry-Academia Program Retention Rate
Parental Leave Reinstatement Rate
Workforce Composition and Diversity & Inclusion
2025 Total Employee Headcount
| Category | Item | Nanshan Plant / Changxing Plant | Suzhou Plant | Dongguan Plant | Total | ||||
|---|---|---|---|---|---|---|---|---|---|
| Male | Female | Male | Female | Male | Female | Male | Female | ||
| Rank | Supervisor | 99 | 40 | 30 | 14 | 33 | 13 | 162 | 67 |
| Non-supervisor | 428 | 391 | 61 | 64 | 119 | 114 | 608 | 569 | |
| Age | Under 30 | 259 | 194 | 12 | 10 | 31 | 24 | 302 | 228 |
| 31-50 | 233 | 207 | 75 | 68 | 102 | 93 | 410 | 368 | |
| 51 and Above | 35 | 30 | 4 | 0 | 19 | 10 | 58 | 40 | |
| Contract | Permanent | 278 | 226 | 60 | 39 | 114 | 95 | 452 | 360 |
| Temporary (Including Migrant Workers and Cooperative Education Students) | 249 | 205 | 31 | 39 | 38 | 32 | 318 | 276 | |
| Total Employees | 527 | 431 | 91 | 78 | 152 | 127 | 770 | 636 | |
Employee Headcount Trends
| Rank | 2023 | 2024 | 2025 |
|---|---|---|---|
| Male Employees | 440 | 689 | 770 |
| Female Employees | 320 | 547 | 636 |
| Foreign Employees (All Genders) | 288 | 280 | 389 |
2025 Employee Gender Composition
Male and Female Employees
View chart data
| Series | Data point | Value | Unit |
|---|---|---|---|
| Male | 2025 | 770 | |
| Female | 2025 | 636 |
Diversified Employment
Persons with Disabilities: 9 employees (5 male, 4 female)
Indigenous Peoples: 18 employees (8 male, 10 female)
Industry-Academia Trainees: 65 participants (40 male, 25 female)
Foreign Workforce: 389 employees (209 male, 180 female)
Foreign Managers: 10 managers (1 Indonesian, 8 Filipino, 1 Vietnamese)
Overview of New and Departing Employee Data
New Employee Composition
| Category | Y2024 | Y2025 | ||||||
|---|---|---|---|---|---|---|---|---|
| Male | % | Female | % | Male | % | Female | % | |
| Under 30 | 110 | 42.47% | 71 | 27.40% | 174 | 39.01% | 144 | 32.29% |
| 31–50 | 35 | 13.51% | 39 | 15.06% | 60 | 13.45% | 66 | 14.80% |
| Above 51 | 3 | 1.16% | 1 | 0.40% | 2 | 0.45% | 0 | 0.00% |
| Taiwan | 102 | 39.38% | 81 | 31.27% | 166 | 37.22% | 139 | 31.17% |
| Suzhou | 12 | 4.63% | 9 | 3.48% | 36 | 8.07% | 36 | 8.07% |
| Dongguan | 34 | 13.13% | 21 | 8.11% | 34 | 7.62% | 35 | 7.85% |
Departing Employee Composition
| Category | Y2024 | Y2025 | ||||||
|---|---|---|---|---|---|---|---|---|
| Male | % | Female | % | Male | % | Female | % | |
| Under 30 | 79 | 38.72% | 51 | 25.01% | 56 | 31.82% | 47 | 26.71% |
| 31–50 | 36 | 17.65% | 32 | 15.68% | 37 | 21.02% | 31 | 17.61% |
| Above 51 | 3 | 1.47% | 3 | 1.47% | 4 | 2.27% | 1 | 0.57% |
| Taiwan | 106 | 51.95% | 68 | 33.33% | 80 | 45.45% | 58 | 32.96% |
| Suzhou | 3 | 1.48% | 5 | 2.45% | 5 | 2.84% | 5 | 2.84% |
| Dongguan | 9 | 4.41% | 13 | 6.38% | 12 | 6.82% | 16 | 9.09% |
Talent Attraction and Retention
TA-I Technology provides a competitive remuneration system. In 2025, the average compensation ratio of male to female employees was 1.1 : 1.
The average salary of employees in the Taiwan region increased by 16% compared to 2024, with the median salary increasing by 13%.
Salary of Non-Managerial Full-Time Employees (Taiwan Sites)
| Item | Y2024 | Y2025 | YoY Change |
|---|---|---|---|
| Number of Employees | 757 | 831 | +9.8% |
| Average Salary (NT$ thousands) | 593.5 | 687.5 | +16.0% |
| Median Salary (NT$ thousands) | 619.5 | 700.0 | +13.0% |
Number of Employees
- Y2024
- 757
- Y2025
- 831
- YoY Change
- +9.8%
Average Salary (NT$ thousands)
- Y2024
- 593.5
- Y2025
- 687.5
- YoY Change
- +16.0%
Median Salary (NT$ thousands)
- Y2024
- 619.5
- Y2025
- 700.0
- YoY Change
- +13.0%
Annual Total Compensation Ratio
| Item/Year | Y2023 | Y2024 | Y2025 |
|---|---|---|---|
| Annual Total Compensation Ratio | 27.26 | 26.06 | 25.44 |
Annual Total Compensation Ratio
- Y2023
- 27.26
- Y2024
- 26.06
- Y2025
- 25.44
Benefits and Allowance Subsidies
- Life Insurance: Group Insurance, Term Life Insurance, Accident Insurance, and Occupational Accident Insurance.
- Health Insurance: Labor Insurance and National Health Insurance (NHI).
- Bonus Benefits: Year-end Bonuses, Employee Profit Sharing, Seniority Bonuses, Birthday Gifts/Vouchers, and Traditional Holiday Gifts/Vouchers.
- Recreation Benefits: Travel Subsidies, Family Days, Diverse Cultural Events, and Year-End Banquets.
- Allowance Subsidies: Marriage Allowance, Housing Relocation Subsidy, Parental Subsidies, Occupational Injury & Hospitalization Condolence Allowances, Bereavement Support, and Departmental Dining Allowances.
- Health Promotion: Regular Health Examinations, Blood Donation Drives, Health Lectures, and Comprehensive Mental and Physical Well-being Programs.
- Employee Dormitories: Open to all domestic and foreign employees, regardless of registered household address.
- Other Benefits: Free catered group meals.
2025 Parental Leave Statistics
| Item | Male | Female | Total |
|---|---|---|---|
| Eligible Employees | 3 | 5 | 8 |
| Number of Actual Applicants | 0 | 5 | 5 |
| Employees Due to Return (A) | 0 | 3 | 3 |
| Employees Returned (B) | 0 | 3 | 3 |
| Return-to-Work Rate (B/A) | – | 100% | 100% |
Eligible Employees
- Male
- 3
- Female
- 5
- Total
- 8
Number of Actual Applicants
- Male
- 0
- Female
- 5
- Total
- 5
Employees Due to Return (A)
- Male
- 0
- Female
- 3
- Total
- 3
Employees Returned (B)
- Male
- 0
- Female
- 3
- Total
- 3
Return-to-Work Rate (B/A)
- Male
- –
- Female
- 100%
- Total
- 100%
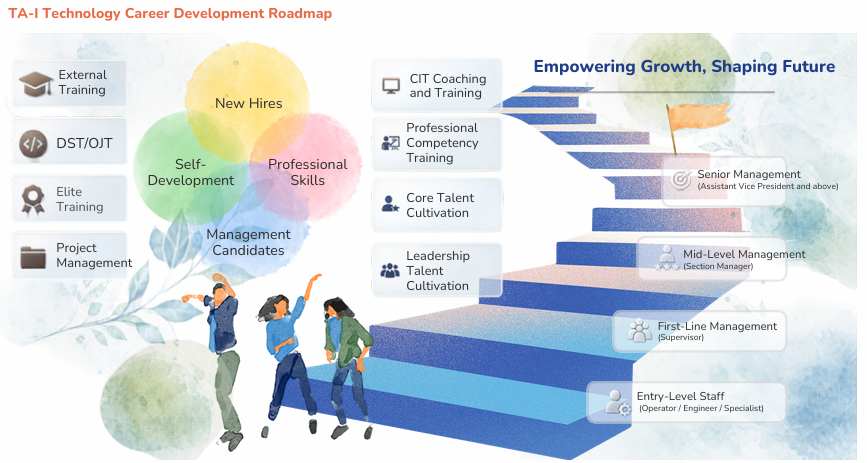
Talent Cultivation and Development
Upholding the core philosophy that “employees are our greatest asset”, TA-I Technology has long implemented the Talent Quality Management System (TTQS) and was awarded the Bronze Certificate.
Four Core Training Categories
Pre-Job Training (New-Hire Training)
Help new employees adapt and join the company culture, including human rights, sexual harassment prevention and information security awareness.
Departmental Professional Training
Build specialist skills for daily departmental work, including R&D, quality assurance and production management.
In-Service Training (Common Competencies)
Quality management (ISO 9001), EHS (ISO 14001 / 45001), energy management and manager leadership training.
Sustainability & Digital Empowerment
Provides training on AI and digital tools, as well as practical training on the RBA Code of Conduct.
Historical Training Hours Comparison (Taiwan Sites)
| Item | Y2024 | Y2025 |
|---|---|---|
| Number of Employees | 1,236 | 1,406 |
| Total Training Hours | 29,685.7 | 27,813.3 |
| Average Training Hours per Employee | 24.0 | 19.8 |
Course Highlights
Industry-Academia Collaboration Achievements
In 2025, out of 40 total graduates, 36 chose to remain with TA-I Technology, achieving an overall retention rate of 90%.
Lunghwa University of Science and Technology: 24 graduates (1 delayed graduation), 20 retained, achieving an 87% retention rate.
WuFeng University: 17 graduates, 16 retained, achieving a 94% retention rate.
Migrant Worker Retention and Development Program (Intermediate Skilled Workforce)
In alignment with government policy to cultivate an “intermediate skilled workforce”, TA-I Technology actively promoted the transition of migrant workers into intermediate skilled technical positions between 2024 and 2025. As of the end of 2025, a total of 11 employees have successfully passed the evaluation and completed the transition.
Employee Opinion Survey
Implementation Status
Survey Highlights and Findings
In 2025, newly added "Sustainability Capabilities" and "Employee Engagement" dimensions recorded the highest scores, reflecting strong workforce alignment with company sustainability initiatives and culture.
- Management: Scored lowest in work-life balance. Managers with 3–5 years tenure face elevated stress and workload.
- Engineers / Specialists: Lower satisfaction due to vague appraisal criteria. 1–3 year tenure staff show potential turnover risk.
- Technicians: Achieved peak scores across all dimensions, exhibiting high organizational engagement and loyalty.
Follow-up Optimization Action Plans
- Work Vitality: Promote smart work practices rather than excessive overtime, while strengthening managers' stress management and coaching skills.
- Compensation & Benefits: Review salary structures between tenured and new staff, driving fair and impactful performance-based differentiated incentives.
- Development Potential: Train managers for two-way appraisal dialogues, providing engineers and specialists with transparent career pathways.
Employee Satisfaction & Engagement Survey Results (Out of 6.0)
| Survey Dimension | 2025 Scores by Job Category | Overall Average Score Comparison | |||
|---|---|---|---|---|---|
| Management (Team Leaders & Above) |
Engineers / Specialists | Operators / Technicians / Assistants | Y2023 | Y2025 | |
| Workforce | 4.68 | 4.17 | 4.84 | 4.83 | 4.68 |
| Compensation | 4.57 | 4.47 | 4.70 | 4.69 | 4.60 |
| Career Development | 4.70 | 4.07 | 4.89 | 4.76 | 4.69 |
| Leadership | 4.81 | 4.31 | 4.95 | 4.97 | 4.79 |
| Corporate Culture | 4.84 | 4.08 | 4.89 | 4.90 | 4.84 |
| Sustainability | 4.89 | 4.37 | 4.99 | – | 4.97 |
| Employee Engagement | 4.77 | 4.17 | 5.10 | – | 4.99 |
| Overall Average Score | – | – | – | 4.81 | 4.76 |
Workforce
2025 Scores by Job Category
- Management (Team Leaders & Above)
- 4.68
- Engineers / Specialists
- 4.17
- Operators / Technicians / Assistants
- 4.84
Overall Average Score Comparison
- Y2023
- 4.83
- Y2025
- 4.68
Compensation
2025 Scores by Job Category
- Management (Team Leaders & Above)
- 4.57
- Engineers / Specialists
- 4.47
- Operators / Technicians / Assistants
- 4.70
Overall Average Score Comparison
- Y2023
- 4.69
- Y2025
- 4.60
Career Development
2025 Scores by Job Category
- Management (Team Leaders & Above)
- 4.70
- Engineers / Specialists
- 4.07
- Operators / Technicians / Assistants
- 4.89
Overall Average Score Comparison
- Y2023
- 4.76
- Y2025
- 4.69
Leadership
2025 Scores by Job Category
- Management (Team Leaders & Above)
- 4.81
- Engineers / Specialists
- 4.31
- Operators / Technicians / Assistants
- 4.95
Overall Average Score Comparison
- Y2023
- 4.97
- Y2025
- 4.79
Corporate Culture
2025 Scores by Job Category
- Management (Team Leaders & Above)
- 4.84
- Engineers / Specialists
- 4.08
- Operators / Technicians / Assistants
- 4.89
Overall Average Score Comparison
- Y2023
- 4.90
- Y2025
- 4.84
Sustainability
2025 Scores by Job Category
- Management (Team Leaders & Above)
- 4.89
- Engineers / Specialists
- 4.37
- Operators / Technicians / Assistants
- 4.99
Overall Average Score Comparison
- Y2023
- –
- Y2025
- 4.97
Employee Engagement
2025 Scores by Job Category
- Management (Team Leaders & Above)
- 4.77
- Engineers / Specialists
- 4.17
- Operators / Technicians / Assistants
- 5.10
Overall Average Score Comparison
- Y2023
- –
- Y2025
- 4.99
Overall Average Score
2025 Scores by Job Category
- Management (Team Leaders & Above)
- –
- Engineers / Specialists
- –
- Operators / Technicians / Assistants
- –
Overall Average Score Comparison
- Y2023
- 4.81
- Y2025
- 4.76
2023 vs. 2025 Employee Satisfaction Comparison
View chart data
| Series | Data point | Value | Unit |
|---|---|---|---|
| 2023 | Workforce | 4.83 | |
| 2023 | Compensation | 4.69 | |
| 2023 | Development | 4.76 | |
| 2023 | Leadership | 4.97 | |
| 2023 | Culture | 4.90 | |
| 2023 | Average | 4.81 | |
| 2025 | Workforce | 4.68 | |
| 2025 | Compensation | 4.60 | |
| 2025 | Development | 4.69 | |
| 2025 | Leadership | 4.79 | |
| 2025 | Culture | 4.84 | |
| 2025 | Sustainability | 4.97 | |
| 2025 | Engagement | 4.99 | |
| 2025 | Average | 4.76 |
Employee Assistance Program (EAP)
To comprehensively care for employees' physical and mental well-being, TA-I Technology has implemented a multifaceted Employee Assistance Program (EAP). The program provides professional, confidential, and stress-free counseling channels to support employees in addressing various work, life, and psychological challenges.
2025 EAP Service Channels
View chart data
| Series | Data point | Value | Unit |
|---|---|---|---|
| 2025 | Individual Counseling | 5 | |
| 2025 | 10 | ||
| 2025 | LINE Counseling | 31 | |
| 2025 | 0800 Hotline | 14 |
2025 EAP Counseling Topics
View chart data
| Series | Data point | Value | Unit |
|---|---|---|---|
| 2025 | Work | 5 | |
| 2025 | Psychological | 17 | |
| 2025 | Legal | 23 | |
| 2025 | Management | 10 |